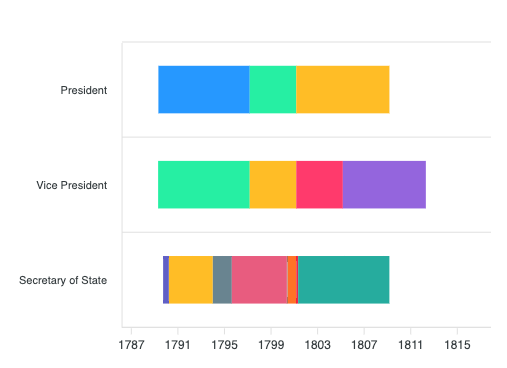
차트를 표현할때 특정값에 의한 차트를 다른컬러로 지정해야 할때 다음과 같은 스크립트로 처리할수 있습니다.
form.addEventListener("chartUpdated", e=>{
// 차트의 행이 2번 그려지는 특징이 있으니 순차를 고려하여 index값을 저정함
let index = (form.dataGrid.rows.length+3) * -1;
e.target.chartEl.updateOptions({
colors: [({ value, seriesIndex, w})=>{
index++;
if(form.dataGrid.rows[index]){
if (form.dataGrid.rows[index].현재고 < form.dataGrid.rows[index].안전재고) {
return '#f1556c';
} else {
return '#1abc9c';
}
}
else {
return '#1abc9c';
}
}, function({ value, seriesIndex, w}) {
return '#f7d83b';
}]
});
});
아래는 차트옵션을 참조할수 있습니다.
