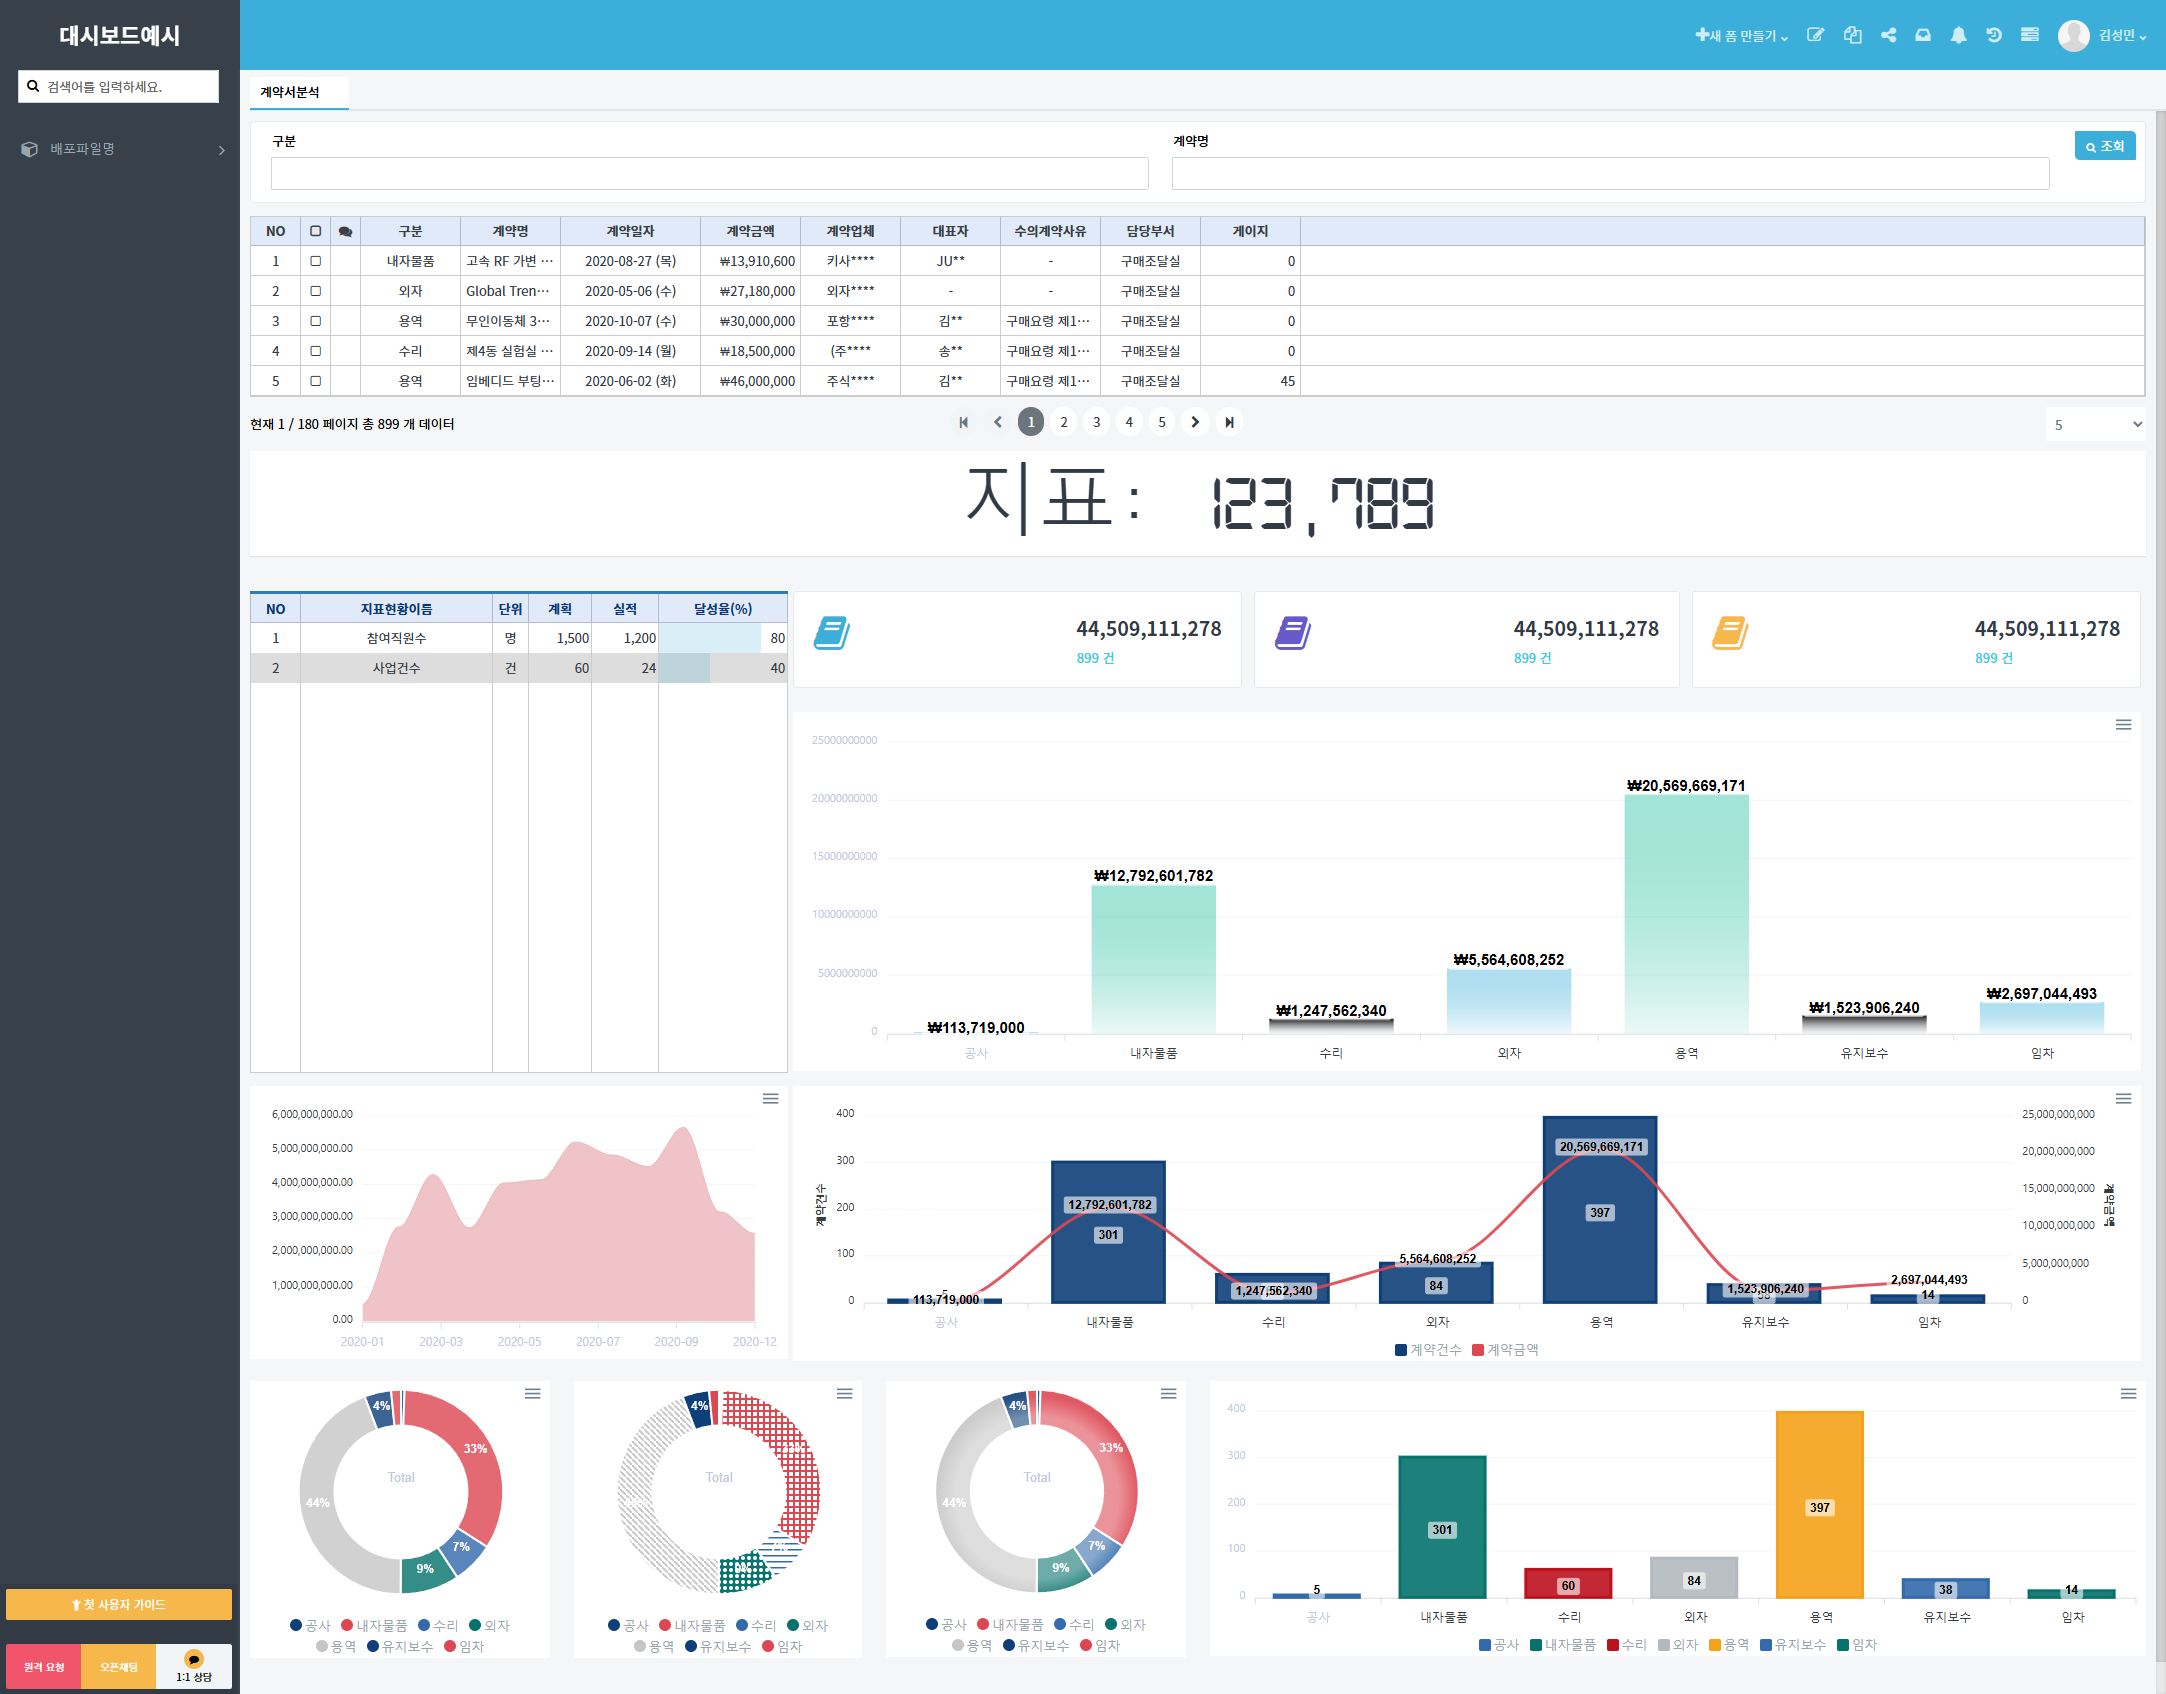
대시보드 구성을 위한 차트의 디자인 속성을 예제로 제공하니 옵션 속성을 이용하여 멋진 대시보드를 구축하기 바랍니다.

1. 배경색 그라데이션 처리및 데이터 라벨 위치 변경하기

form.chart10.addEventListener("chartUpdated", e=>{
  e.target.chartEl.updateOptions({
    plotOptions: {
      bar: {
        dataLabels: {
          position: 'top', // top, center, bottom
        },
      }
    },
    stroke:{
      width:0,
    },
    dataLabels: {
      enabled: true,
      offsetY: -20,
      style: {
        fontSize: '15px',
      }
    },
    fill: {
      type: 'gradient',
      gradient: {
        shade: 'top',
        type: "vertical",
        stops: [0, 100],
        opacityFrom: 0.9,
        opacityTo: 0.3,
      }
    }
  });
});
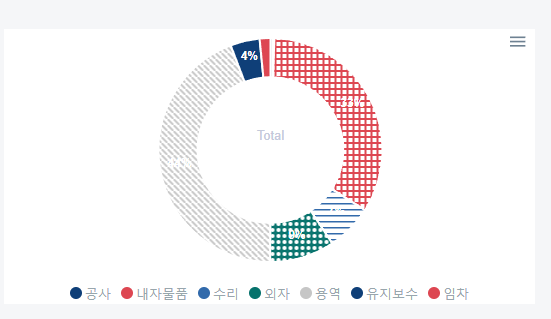
2. 도넛차트에 패턴/ 그라데이션 넣기

form.chart20.addEventListener("chartUpdated", e=>{
  e.target.chartEl.updateOptions({
      fill: {
        type: 'pattern',
          opacity: 1,
          pattern: {
            enabled: true,
            style: ['verticalLines', 'squares', 'horizontalLines', 'circles','slantedLines'],
          },
        },
  })
})

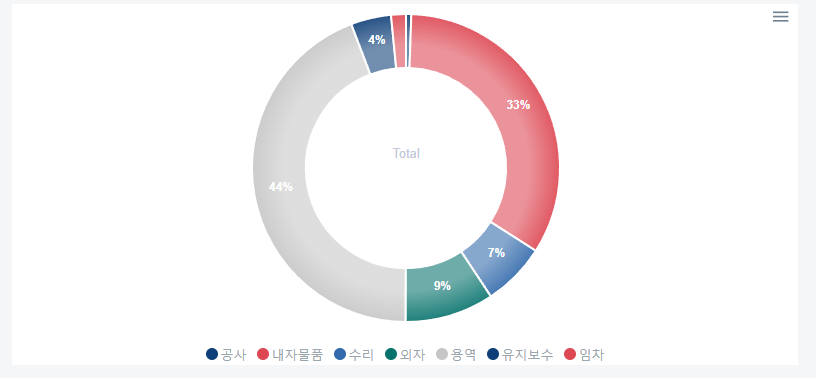
Gradient Donut Chart in React.js – ApexCharts.js
Checkout the sample code for gradient donut chart in React.js
https://www.apexcharts.com/javascript-chart-demos/pie-charts/gradient-donut/
form.chart21.addEventListener("chartUpdated", e=>{
  e.target.chartEl.updateOptions({
    fill: {
      type: 'gradient',
    }
  })
})
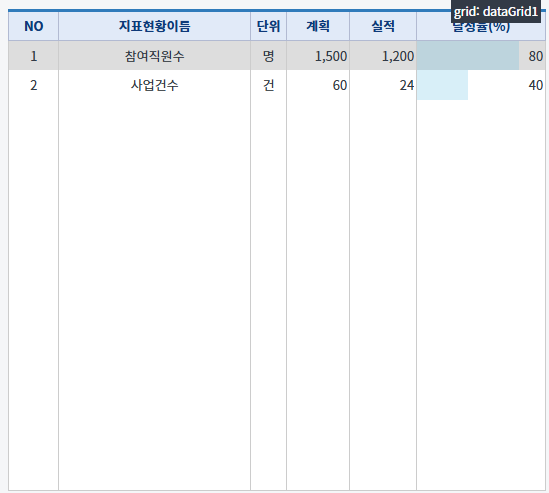
3. 대시보드용 표 스타일 넣기

[jj-id="dataGrid1"]{
  td {
    border: none!important;
    border-right: 1px solid #cccccc!important;
  }
  jj-pagination{
    display: none!important;
  }
  margin-bottom: 1rem;
}